Friday, February 18, 2011

part 2 / 13 : install firebug

up to now there is no version of aptana debugger to work with firefox 4 or 5 so you have to install the last firefox 3.x.x. To get it, go here : http://www.oldapps.com/firefox.php


Firebug is necessary to debug with aptana.


In firefox, go here: https://addons.mozilla.org/en-US/firefox/addon/firebug/
and click on "Add to firefox".
Then, clik the 'Install' button.
click on "Reboot firefox".

it's done.


[edit 16/03/2011]
VERY IMPORTANT
22/02/2011:
With my configuration there is a bug with firebug 1.6.2 and aptana. It's not working properly. For example, in case of an error, I don't get the variable stack.
My config : windows 7 64bits firefox 3.6.13


in this case, go there:
https://addons.mozilla.org/firefox/addon/firebug/versions/
to install firebug 1.5.4


to do not have the automatics update:
in the address bar:
about:config


click right in the window
new->boolean value
in the new value window:


paste:
extensions.{CAFEEFAC-0016-0000-0021-ABCDEFFEDCBA}.update.enabled
cllick OK


a new window appear:


select false
click OK


part 3 / 13 : install xampp 1.7.4

If you have windows 7 64 bit, don't install this version, it's unstable, install the 1.7.3. This post explain how to do.

If your OS is vista or windows 7 you have to deactivate the User Account Control (UAC).
In this page, you'll get all the explanation to do it.

Now, run the installation of xampp.
The vista and windows 7 users should get a window which indicate that the UAC is disable.

Then you'll have to choose the destination folder:

keep the default one:
windows: c:\xampp
ubuntu/linux/mac:  please leave me a comment to let me complete this.

Then, you can choose to install apache, MySQL and Filezilla as services. Not needed in our case.

Press install. It take a bit of time to be installed, it's normal.

When the install is done, you should have this icon in your desktop:

Press it to run XAMPP control, if you have w7 64bit, you'll get this window:

You'd better to install the 1.7.3 version!
Press OK.

Finally you'll get the XAMPP Control Panel Application window:


when you press a Start button, you should get this:
The Admin button permit to access to the parameters, we'll use it later.
Stop everythings and press Exit button.


More about xampp: http://www.apachefriends.org/

Note to linux/mac users: please, make comments to complete this post if you know how to do it with your OS. I'll update the post.

In the next post: will configure xdebug, the php.ini and the httpd.conf

part 4 / 13 : xdebug, php.ini and httpd.conf

Now, we have to get xdebug working.

php.ini
you'll find the file here:
windows: c:\xampp\php\php.ini
linux/mac: write a comment if you know, I'll update the post!

first of all make a copy of it.

Xampp integrate xdebug, so, there is no need to compile the version you need just change some lines in php.ini and it will run.

Open php.ini with the a text editor. The ";" are used to make comments, you have to remove it for thoses lines and modify the line if necessary like shown here:

;zend_extension = "C:\xampp\php\ext\php_xdebug.dll"
            =>  zend_extension = "C:\xampp\php\ext\php_xdebug.dll"

;xdebug.remote_enable = 0               =>    xdebug.remote_enable = on
;xdebug.remote_handler = "dbgp"     =>     xdebug.remote_handler = "dbgp"
;xdebug.remote_host = "localhost"    =>     xdebug.remote_host = "localhost"
;xdebug.remote_port = 9000            =>     xdebug.remote_port = 9000

save the file, it's done! Xdebug should work.

httpd.conf
To get everythings working correctly I had to modify the httpd.conf but I'm not sure it's necessary for all the config.
My config: xampp 1.7.3 / w7 64bits
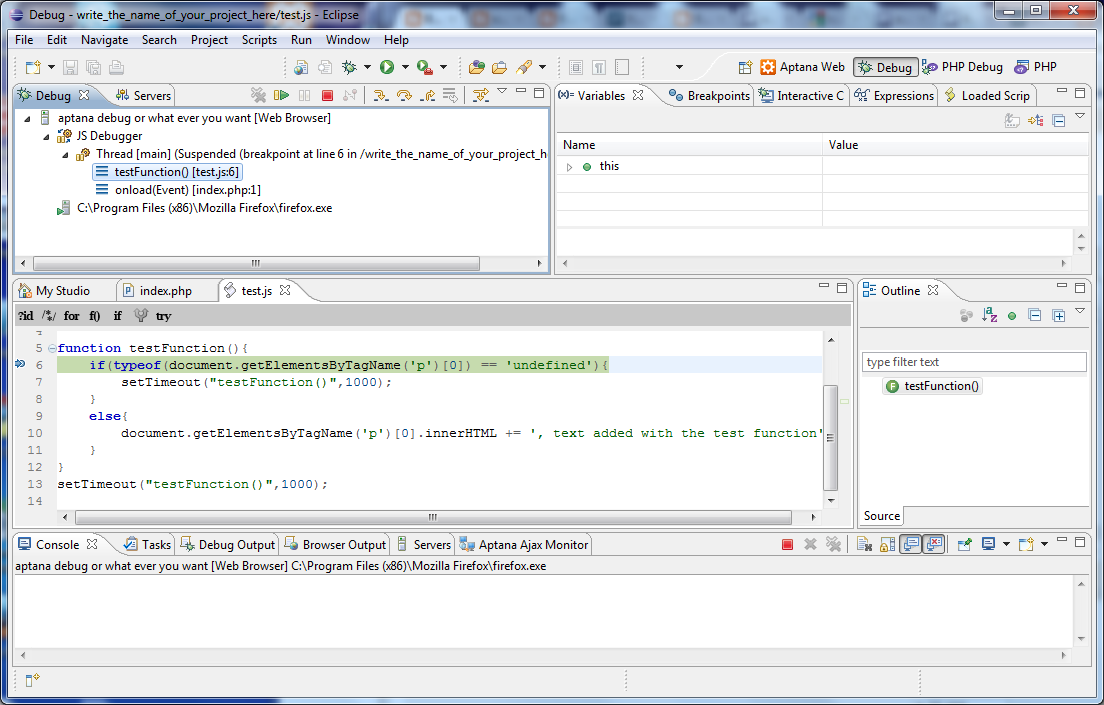
If I don't do this modification, the javascript debugger don't stop on the breakpoints

Anyway, it will not be a problem  if you do  this modifiction.

you'll find the file here:
windows: C:\xampp\apache\conf\httpd.conf
linux/mac: write a comment if you know, I'll update the post!

make a copy of the file before to make the modifications.
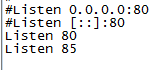
find the line:
Listen 80


in the next line write:
Listen 85

For those who have windows7 64 bits and trying to use it with xampp1.7.4. I made it works but I had to remove the "Listen 80" line. And it was really unstable. In that case, if you want to access to your server, localhost/ will not work, you always have to specify the port: localhost:85.


Before to go, we'll verify that xdebug is configurated.
Open XAMPP control panel. If apache is running, stop it. Apache must be restart to take in account the new configuration.
Press start to run apache.

Press admin at the side of the start button. It should launch your default web browser with a page where you have to choose you language. If it's not working, open a browser and write : localhost/ has the address.

 You'll get a welcome page to XAMPP.

On the left side, press phpinfo().
And look for xdebug in the page, you should found this:

If not, verify the configuration you've done in the php.ini file.

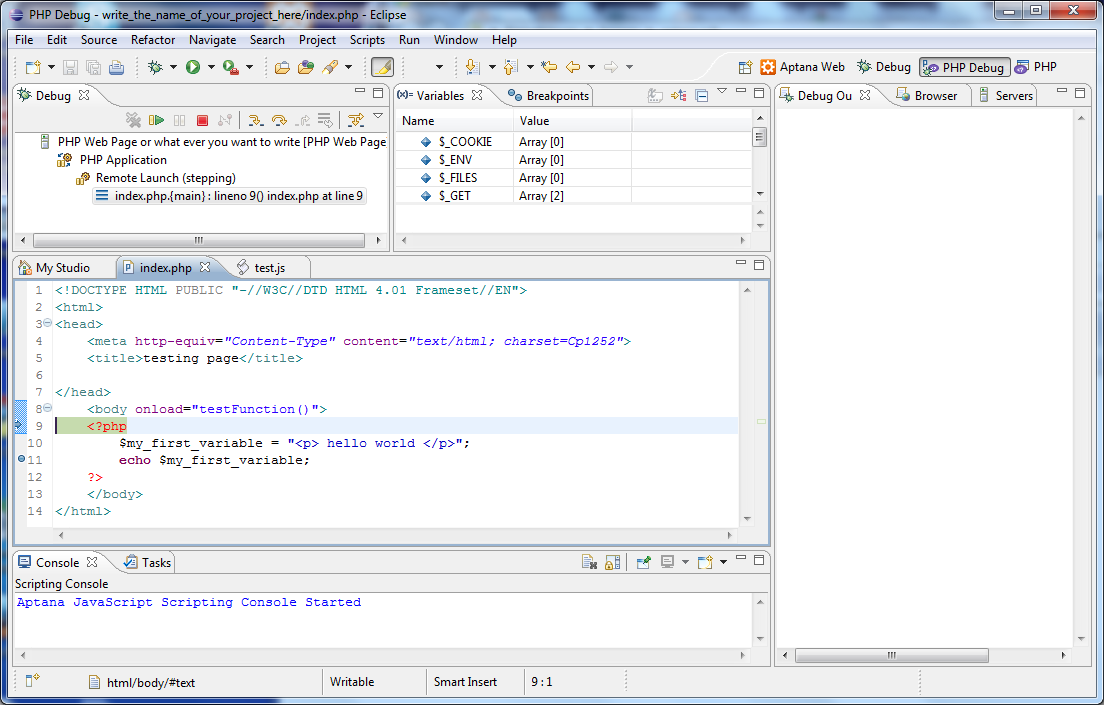
We're done for this part. On next part we'll install eclipse PHP.

more about xdebug :
http://www.xdebug.org/docs/all_settings
here the tuto which I used to have xdebug work:
http://www.eclipse.org/pdt/articles/debugger/os-php-eclipse-pdt-debug-pdf.pdf

part 5 / 13: Install eclipse PHP all-in-one

You should have download eclipse-PHP when you read the first post. If it's not done go here:
http://www.eclipse.org/pdt/downloads/ and choose the All-In-One you need. The torrent is more efficient.

Then unzip the zip file in c:/

it create an eclipse folder. Find the executable file:
 eclipse.exe
and create a shortcut to the desktop.
run it.

it will propose you a default work space, change it to:

choose c:/xampp/htdocs

Select: "Use this as the default and do not ask again" and press OK.

Eclipse PHP opens on a welcome tab, close it

The next post is the explanation to install aptana studio instead of eclipse, go directly to the following one in which we will create a new php project.


part 5 / 13 : Install Aptana Studio

Note: I did not modify this part from the time the version 3 of aptana studio has been launch. Then you´ll found the explanation for the version 2.

If you want to install Aptana instead of eclipse. Go here: http://www.aptana.com/products/studio2/download, Install it.
Then install the pdt plugin in aptana:
In Window->Show View->Other...
A new window opens.
then select: Aptana Views->Plugins Manager
press OK

The plugin manager appear:


click on:

And select the PDT plugin:


Press Install.

The next post is explained with an eclipse PHP installation. It should not be a problem to follow. If you have a problem, write a comment.

Go to the next post: open New PHP Project. 

For linux/max users : any comment to adapt these explanations for your OS will be great.

part 6 / 13 : New PHP project

To create a PHP Project:
File->new->Project..
PHP->PHP Project
Next

You get a new window, set the values has shown:


For xampp 1.7.3 or 1.7.4, select PHP 5.3.
If you have an other version of xampp, set the corresponding value of PHP version.

It's not necessary to Enable Javascript support, I have not tested it yet. Anyway, aptana will support javascript.

Press "Finish" button.

Your project is created.

You should be in the PHP perspective, which is selected with:

If not, press it. You'll found it in the up right corner.

To create a html.php file click right on your project and New->PHP file.

In File Name: index.php
Press Next button

and select 'New PHP file - HTML frameset':


It's possible to modify the template or import some, to do it press PHP Templates
Press "Finish" button.
The new file appear in the editor.

If you prefere to create an index.html file, it's up to you but I have not manage to debug it with the php debug.

In the next post we'll configure the external browser.

Note to linux/ mac users: if you see differences with your eclipse version, write a comment, I'll update the post to signal it.

part 7 / 13 : external web browser

We'll set the external web browser:

Windows->Preferences
General->Web Browser
New...

Set it like this:

Note to linux/mac users: write a post to give me the Location to write here in your case.

Press OK.


select: Use external web browser 
and: firefox


Press OK.


Done.

Next step: set the parameters for PHP debugging.

part 8 / 13 : setting PHP debug parameters

in Window->Preferences

in PHP->PHP Interpreters
for xampp1.7.3 or 1.7.4: PHP Version: PHP 5.3

in PHP->PHP Executables
Add...
And set the values like here:

Press Finish.

If you have other PHP executable definitions, make sure the one we configure is set as default:

To do it, select "PHP_Exec (CLI)" and press "Set Default".
If you have only one definition, it will be set as default and the 'Set Default' button will be inactive.

in PHP->PHP Executables->Execution Environnements
select php5.3 and then PHP_Exec (CLI)
(I'm not sure this is necessary to do).

in PHP->debug
set the fields as shown :

press OK

in PHP->debug->Installed Debugger
select XDebug

Click on "Configure".

Set "Accept remote session (JIT)" to "any"
Click OK.

Then an other time OK.


Done.

Next step: create a debug configuration for PHP debug.

part 9 / 13 : Set a debug configuration for PHP debug

First of all, we'll modified the index.php:
Open index.php file. And modify it as shown here:

and save it: Ctrl+S
Then add a breakpoint in front of the line: echo $my_first_variable;
To do it, do a double click on the left of the text, a blue point will appear as shown on the last picture.

Start xampp:
on your desktop click on:


Then press Start to run apache, you'll get:


Come back to eclipse.


Run->Debug Configuration...
select: PHP Web Page
Press the 'New' button:
                                    
And complete the parameters as shown:

Press "Debug" to launch the debug session.

Eclipse ask you to confirm to switch Perspective:

select: Remember my decision
and click Yes.

If eclipse did not asked you to open the PHP Debug perspective, you'll found it like this:
Window->open perspective->Other...
PHP Debug
OK

A firefox window opens.

In eclipse, if you left the "break at first line" in the parameters we set above, you should see that:

The session is break on the first line of the php script.
Press  and the execution will go to the next breakpoint.
Press  again, the execution will end.

In the firefox window, you'll see the result of the execution.

you can see "XDEBUG_SESSION_START=ECLIPSE_DBGP&KEY=12981329118077" after the link to your web page. For each debug session xdebug set a key number.

You don't need to restart the debug from eclipse. You can make change in eclipse editor and reload the page from firefox, try it.
To close the debug session press '"ctrl + F2" and then :near the 

Done.

Next post: installation of aptana plugin.

part 10 / 13 : install aptana plugin

Note : I did not upgrade the picture to fit with the new aptana studio 3 plug-in. I ll do it when I got time.

First go there: http://www.aptana.com/downloads/start.
Choose Eclipse Plug-in Version
And click download.

A new page is opened with all the explanations.

Click on the icon, next to the link, it will act as you have done a copy of the link.

Then come back to eclipse.
Help-> Install New Software...
in Work with: paste the link then press Add...
in Name, write "aptana" or whatever you want to write.
OK

Then you have to wait, that a new line appear in the main section of the window:

select Aptana Studio and click Next
An other view appear, Next again.
You have to accept the terms of the licence agreements and press Finish.
You'll get this window:

Just wait.

On this window:

Click OK

On the next window, click Restart Now.

Done. On the next post will set the aptana parameters.

part 11 / 13 : setting aptana's parameters (local server)

12 julio 2011 : this part is unusfull since the aptana studio 3 plugin. I live it for the ones still using aptana studio 2 for the other, directly go to the next step.


First will configure aptana to use the xampp server:

Window->Show View->Other...

Select Aptana Views->Servers and click OK.

A new tab opens:

Click the add server button:
select Apache and click OK

set the parameters as shown here:

click OK.

Note: you have to add: Listen 85 in the httpd.conf file. See here:
http://aptanaandpdt.blogspot.com/2011/02/xdebug-phpini-and-httpdconf.html

Note:

Done.

In the next post, we'll configure a debug configuration.

part 12 / 13 : Set a debug configuration for aptana

 updated the 12 julio 2011 for aptana studio 3 plug-in.

First of all we'll add a bit of javascript:

Open the aptana perspective:
Window->Open Perspective->Other...


select Web and click OK

Before to create a new javascript file, we'll set the default editor for them as the aptana editor:
Window->Preferences
General->Editors->File Associations


Select "*.js" in "Files types" and then "JavaScript Source Editor etc.." in "Associated editors".
And click on default. The "JavaScript Source Editor" will be up to the top of list.
Click OK.

Create a new javascript file:
click right on your project
New->Other...

On the next window select Web->File and press Next.

In the next window:


As file name set : test.js and click Finish.

A new tab appear in the editor with the test.js file opens.
copy this to test.js:

function testFunction(){
if(typeof(document.getElementsByTagName('p')[0]) == 'undefined'){
setTimeout("testFunction",1000);
}
else{
document.getElementsByTagName('p')[0].innerHTML += ', text added with the test function';
}
}
setTimeout("testFunction",1000);


you'll obtain this:


set a breakpoint as shown on the picture and you'll get the blue point.

Then open the index.php file.

Modify it to add the javascript file:
add this line in the <head> section:
<script src="test.js" type="text/javascript"></script>


and save it: Ctrl+S

Open the Xampp Control Application and run apache.

Back in eclipse.
Run->Debug Configuration...
select Web Browser and click the "new" button:
you´ll get this:


Click "Configure" on the left of "Use selected server" field then the "New..." button and then select "simple Web Server", you ll got the underneath window, fill it as shown :


click "OK".

Then fill the Debug Configuration window as shown here:


Click Debug to run a debug session.

On this window:

select "Remember my decision" and click Yes

A new firefox window is opened with "hello world" writen.

The execution has stopped on the breakpoint we set:

Resume with F8 and the javascript will be execute. Now, you should see:
"hello world , text added with the test function" in the firefox window.
Ctrl+F2 to terminate andto remove all terminated launches.

Everything is working :-).

Enjoy.

The last post: a bit more but very useful.